Three domains,
one system
ExactH2O is built for controlled-environment work where water must be measured, repeated, and explained. One platform supports configurable sensors, per-pot or per-zone targets, sampling cadence, and a continuous record across stress studies, phenotyping, and greenhouse operations.
Plant Stress
Experiments
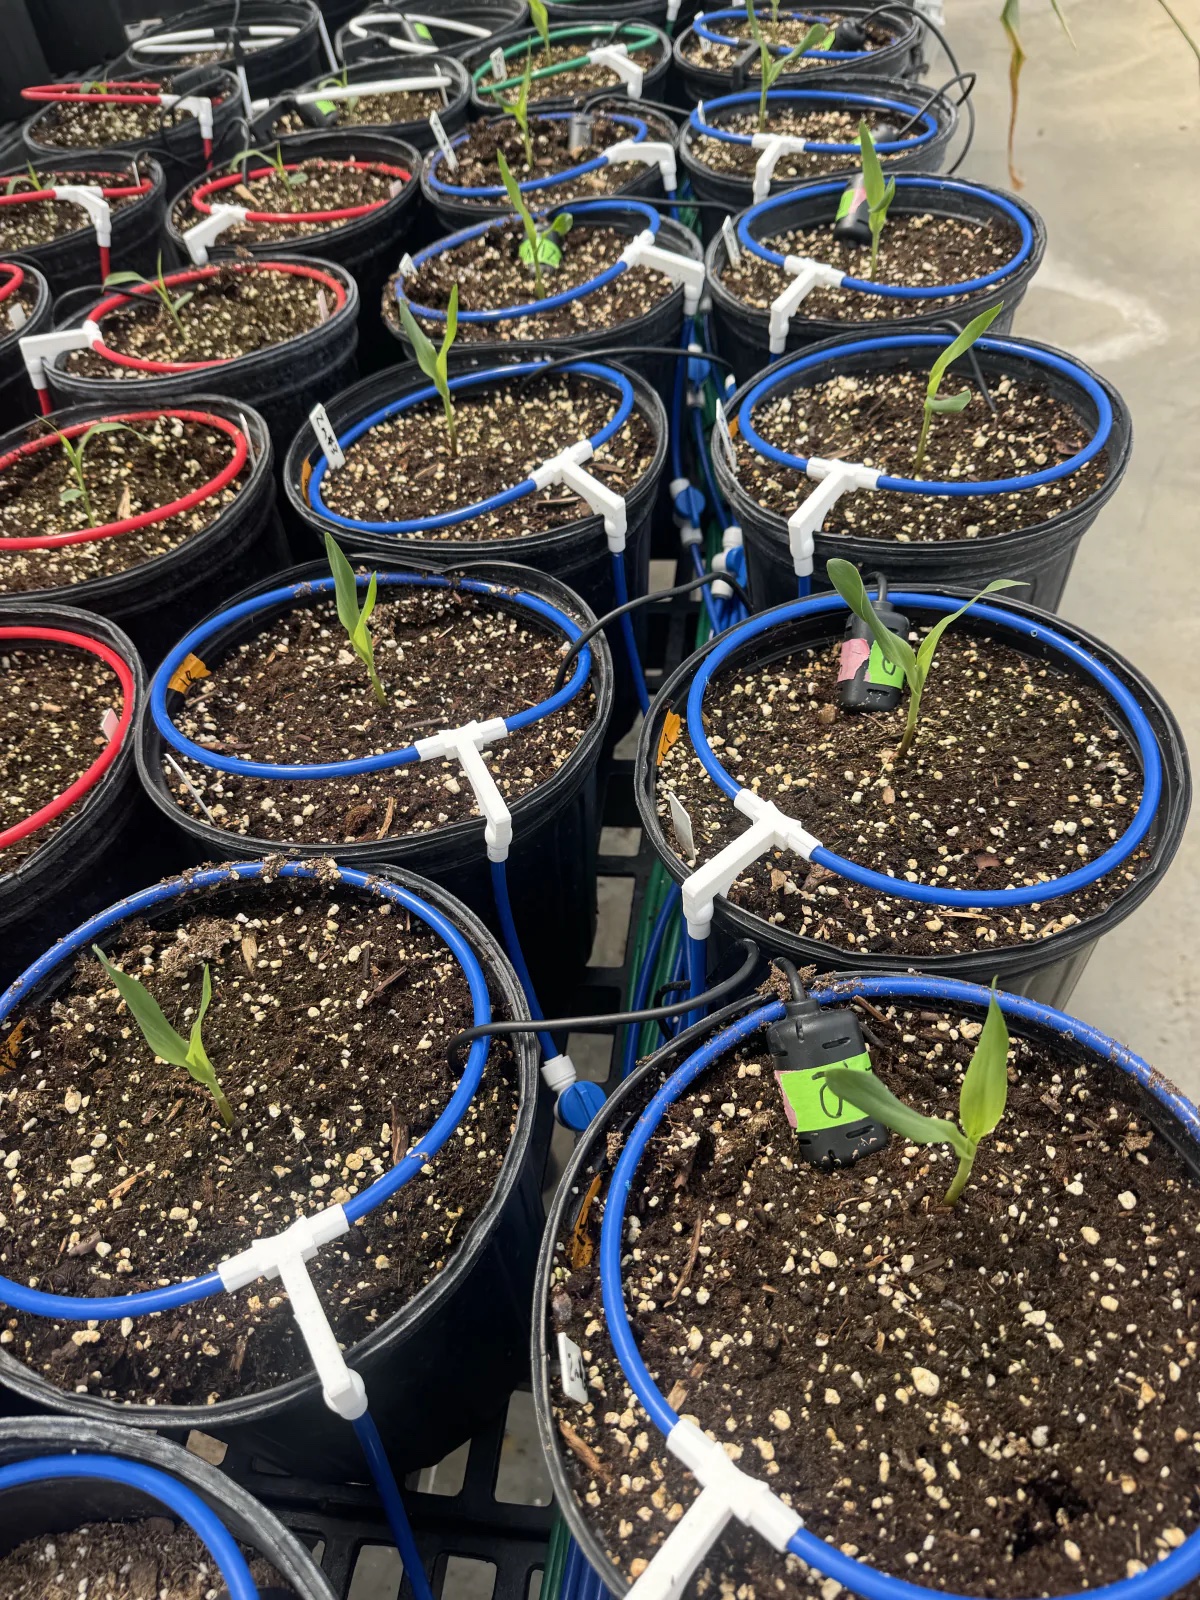
Set and hold defined substrate-water targets across replicated pots for controlled drought, recovery, and stress-response studies. Continuous readings preserve each pot's water trajectory for comparison with physiological measurements and biomass.
Plant
Phenotyping
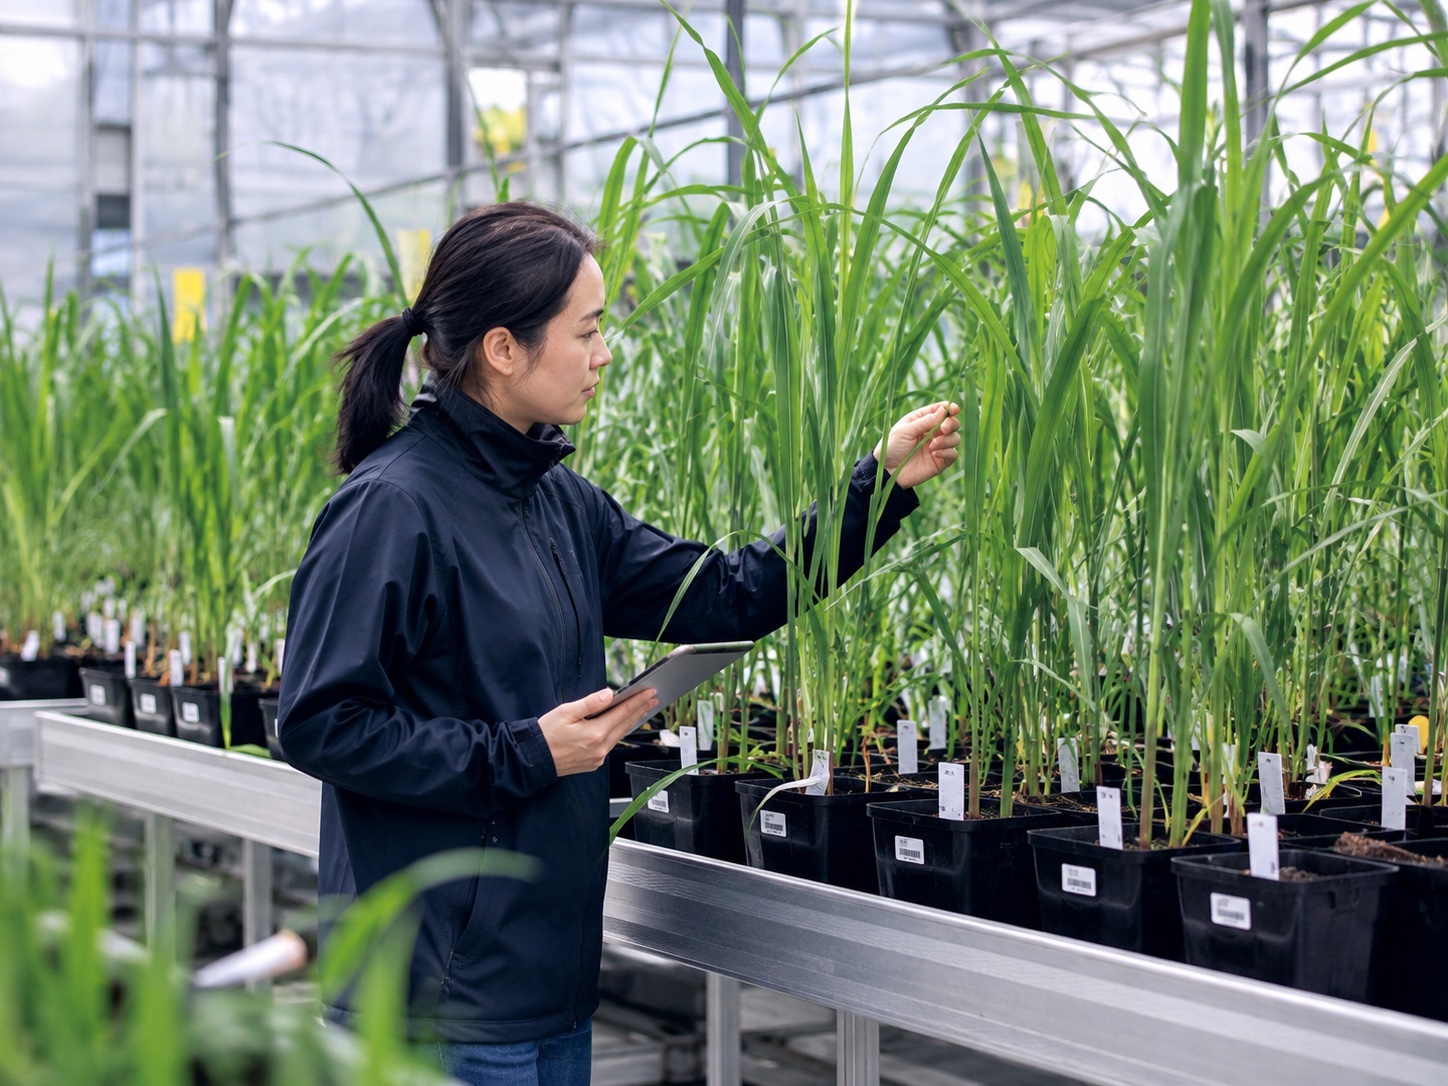
Apply consistent water regimes across genotypes so growth and stress-response differences are less confounded by uneven irrigation. Per-pot water histories support phenotyping analysis and environmental-quality review.
Research & Commercial
Greenhouses
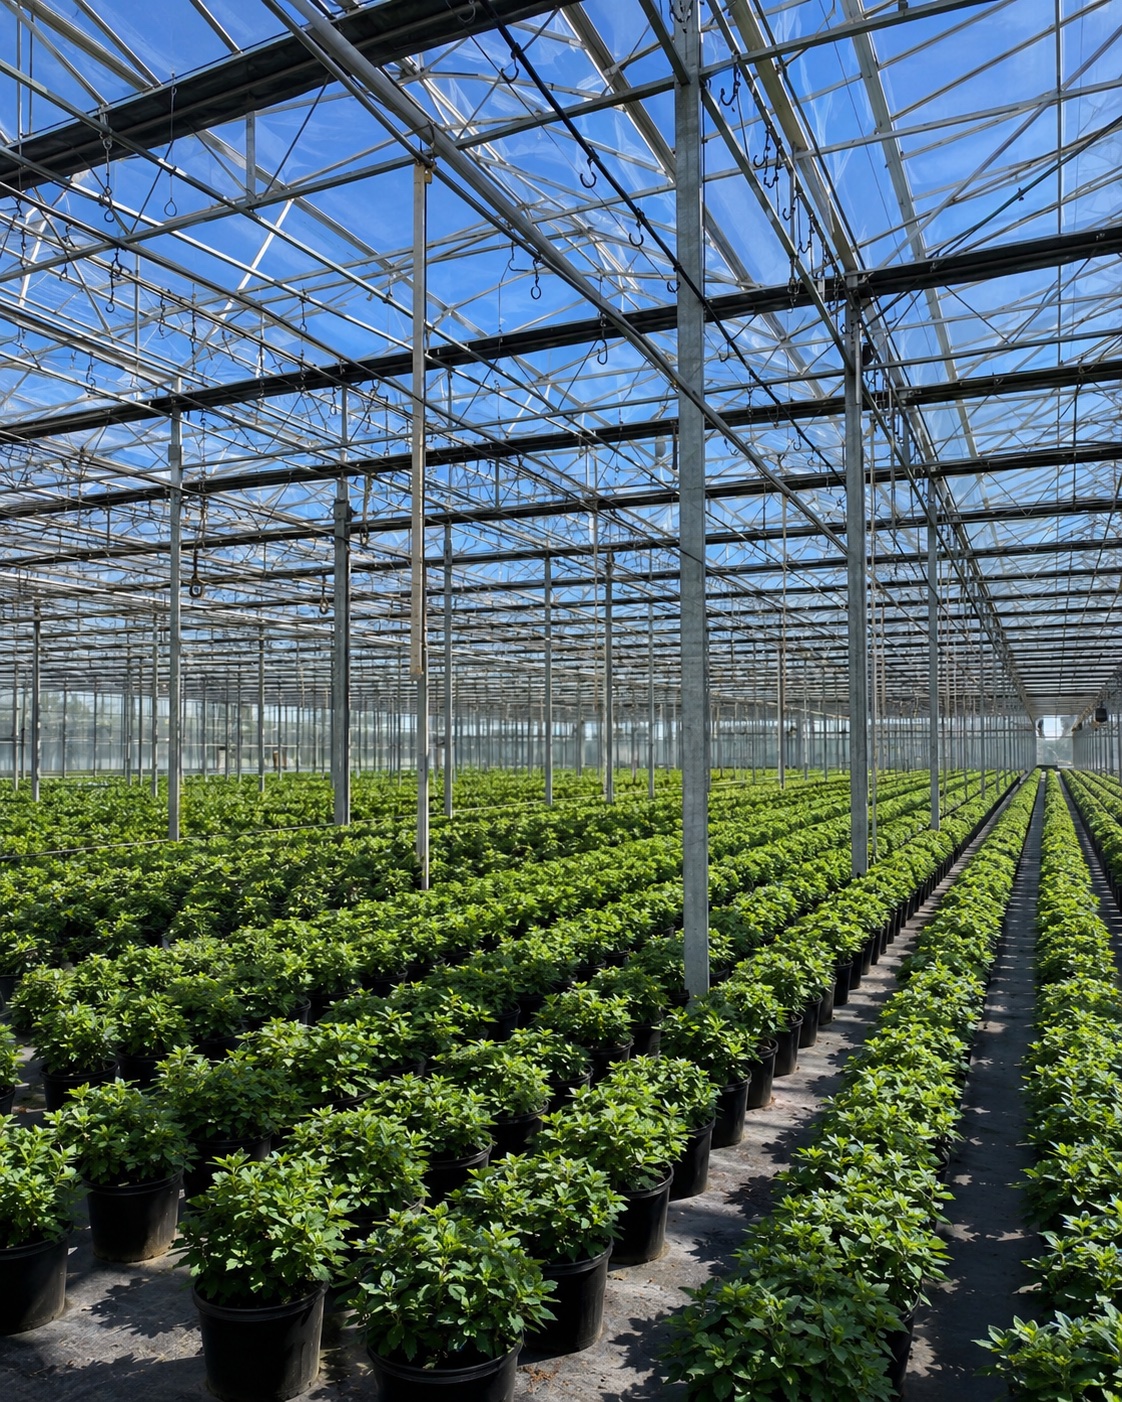
Monitor and control irrigation across greenhouse benches and container arrays while preserving independent targets and histories by zone. Built for research facilities and commercial greenhouse workflows.
-
Reproducible, Citable DataTimestamped, sensor-ID-tagged readings with calibration traceability — ready for supplementary data tables in publications.
-
Closed-Loop Irrigation ControlDefine target VWC thresholds per zone. The system irrigates to target and stops — eliminating overwatering, underwatering, and manual error.
-
Media-Specific CalibrationCalibration coefficients can be tuned for the media used in each experiment, correcting for dielectric variability.
-
Scalable Node ArchitectureStart with a single bench and expand across multiple greenhouse zones as the deployment grows.
-
Open Data ExportExport system data for analysis in common research workflows; specific formats and integrations are confirmed during system planning.
-
Continuous System VisibilityLive readings, irrigation history, and sensor status make each zone's behavior clear from the web dashboard.